dkidi
Satellite Imagery and AI Agent-Based Crop Condition Monitoring and Investment Decision Support Program
위성영상과 인공지능 에이전트 기반 농작물 작황 모니터링 및 투자 의사결정 지원 프로그램
What it does
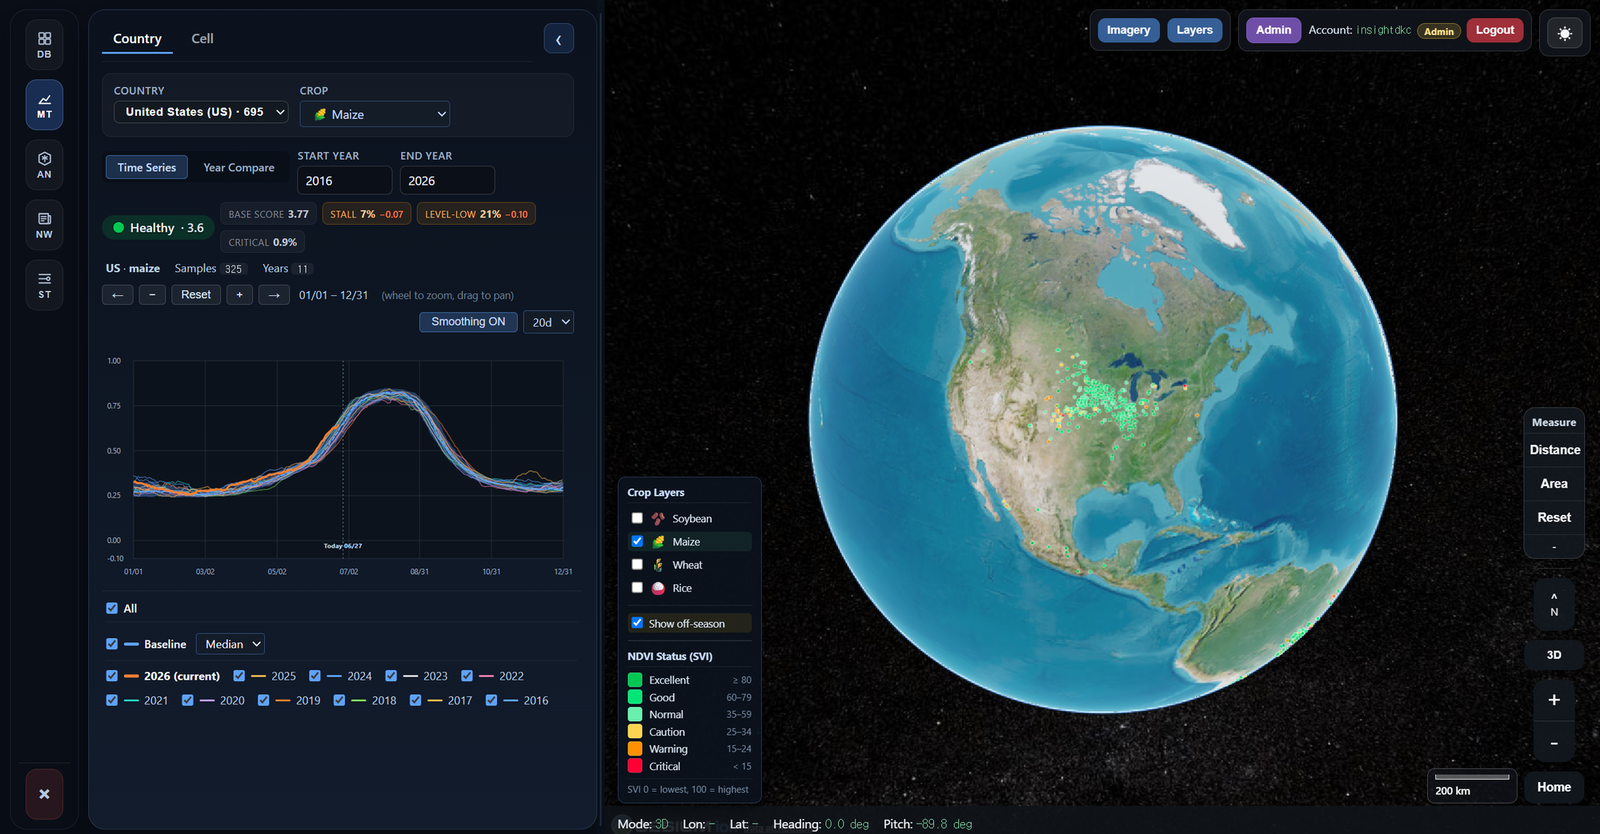
dkidi turns satellite imagery into actionable crop intelligence. We collect Google Earth Engine MODIS daily 250 m NDVI for tens of thousands of sample points across top producer countries, compute a Standardized Vegetation Index (SVI) against a rolling 10-year baseline, and surface crop condition as a 6-tier grade (Excellent → Critical) on a 3D Cesium globe.
Real-time satellite signals are paired with USDA WASDE, NASS, NOAA, EIA, and CBOT futures (corn / wheat / soybean) so investors and analysts can move from satellite signal to price impact in a single workflow. The entire data stack is queryable in natural language through an Anthropic Claude–powered AI agent.
Live product screenshots
Key capabilities
- Satellite NDVI pipeline — Google Earth Engine MODIS MOD09GQ daily 250 m, QA-masked, 3×3 neighborhood, batch FeatureCollection or per-point modes
- Standardized Vegetation Index (SVI) — z-score against rolling 10-year baseline, mapped to 0–100 score and 6-tier grade with percentile clipping
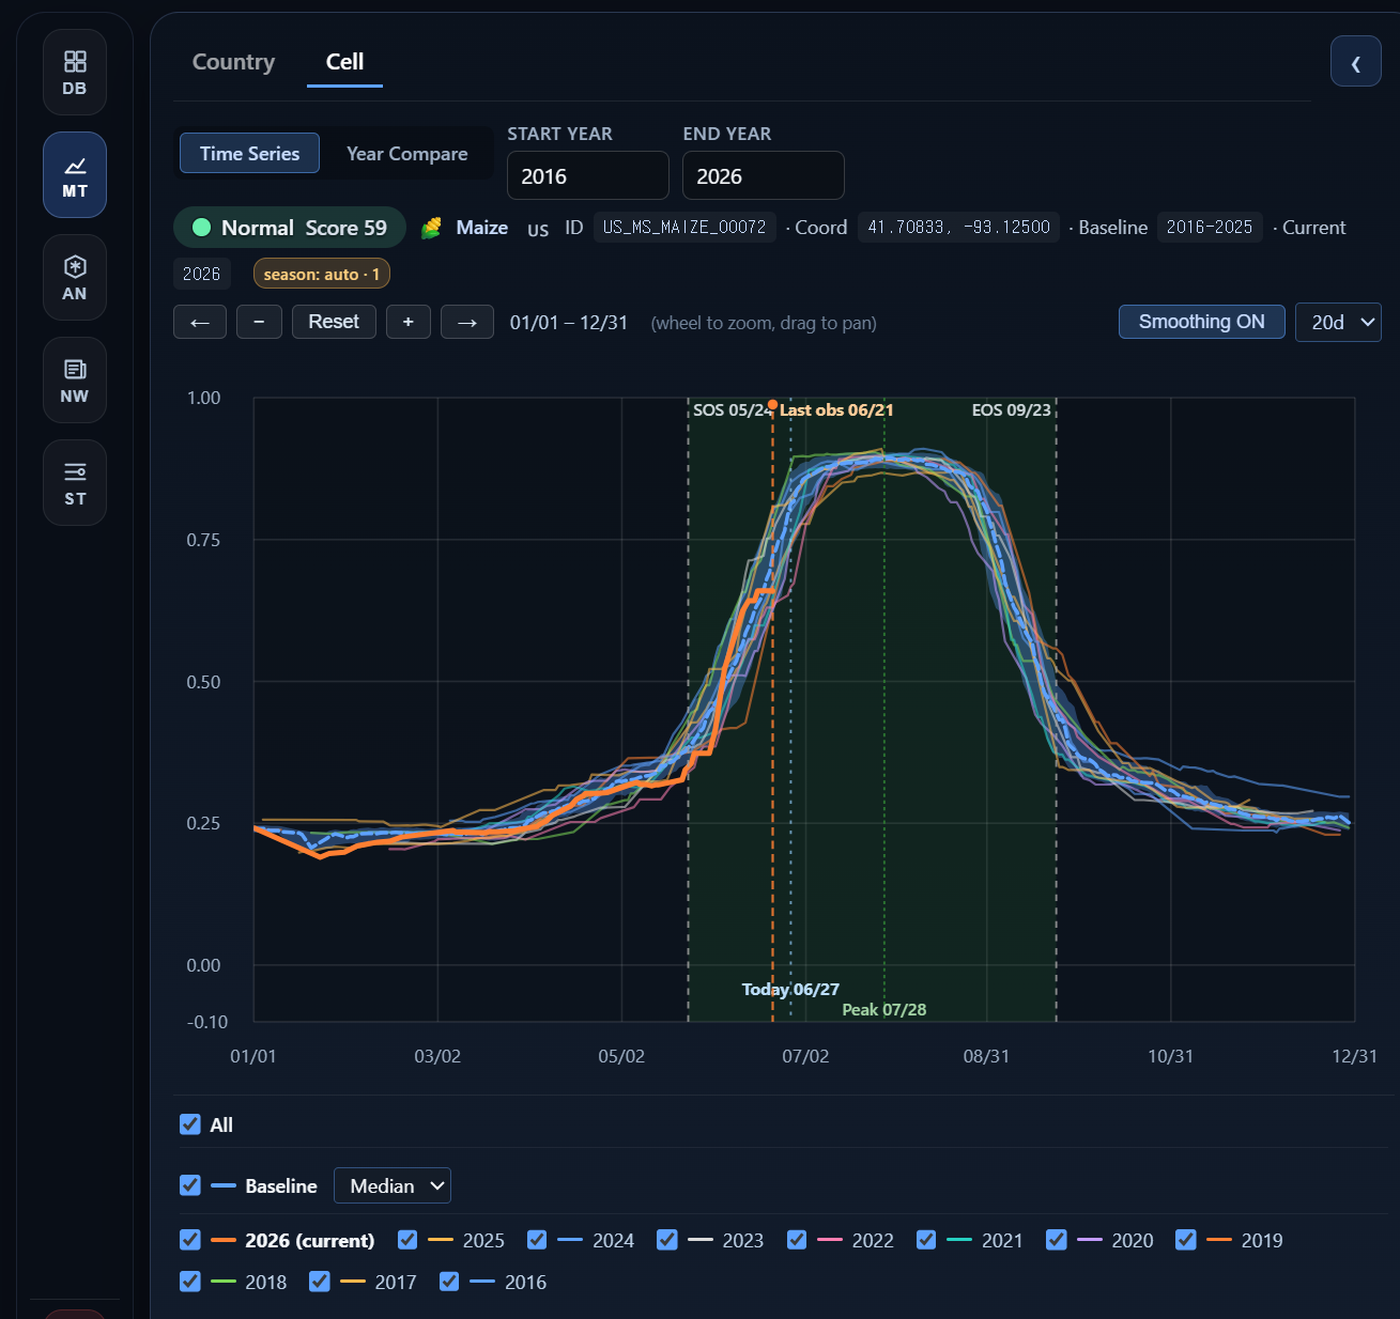
- Hybrid season detection — GEOGLAM CM4EW lookup → NDVI auto-detection v2 → none fallback; SOS / EOS / Peak DOY extraction
- Stall detection — in-season green-up stall escalates country to Watch tier (one-way upgrade)
- 3D globe visualization — Cesium WebGL Earth with multi-crop layer toggle, sample point dots, country-level color dots, off-season override
- Time-series chart — Recharts multi-year NDVI comparison, baseline median / mean / max / min lines, smoothing, season shading, today + last-observation markers
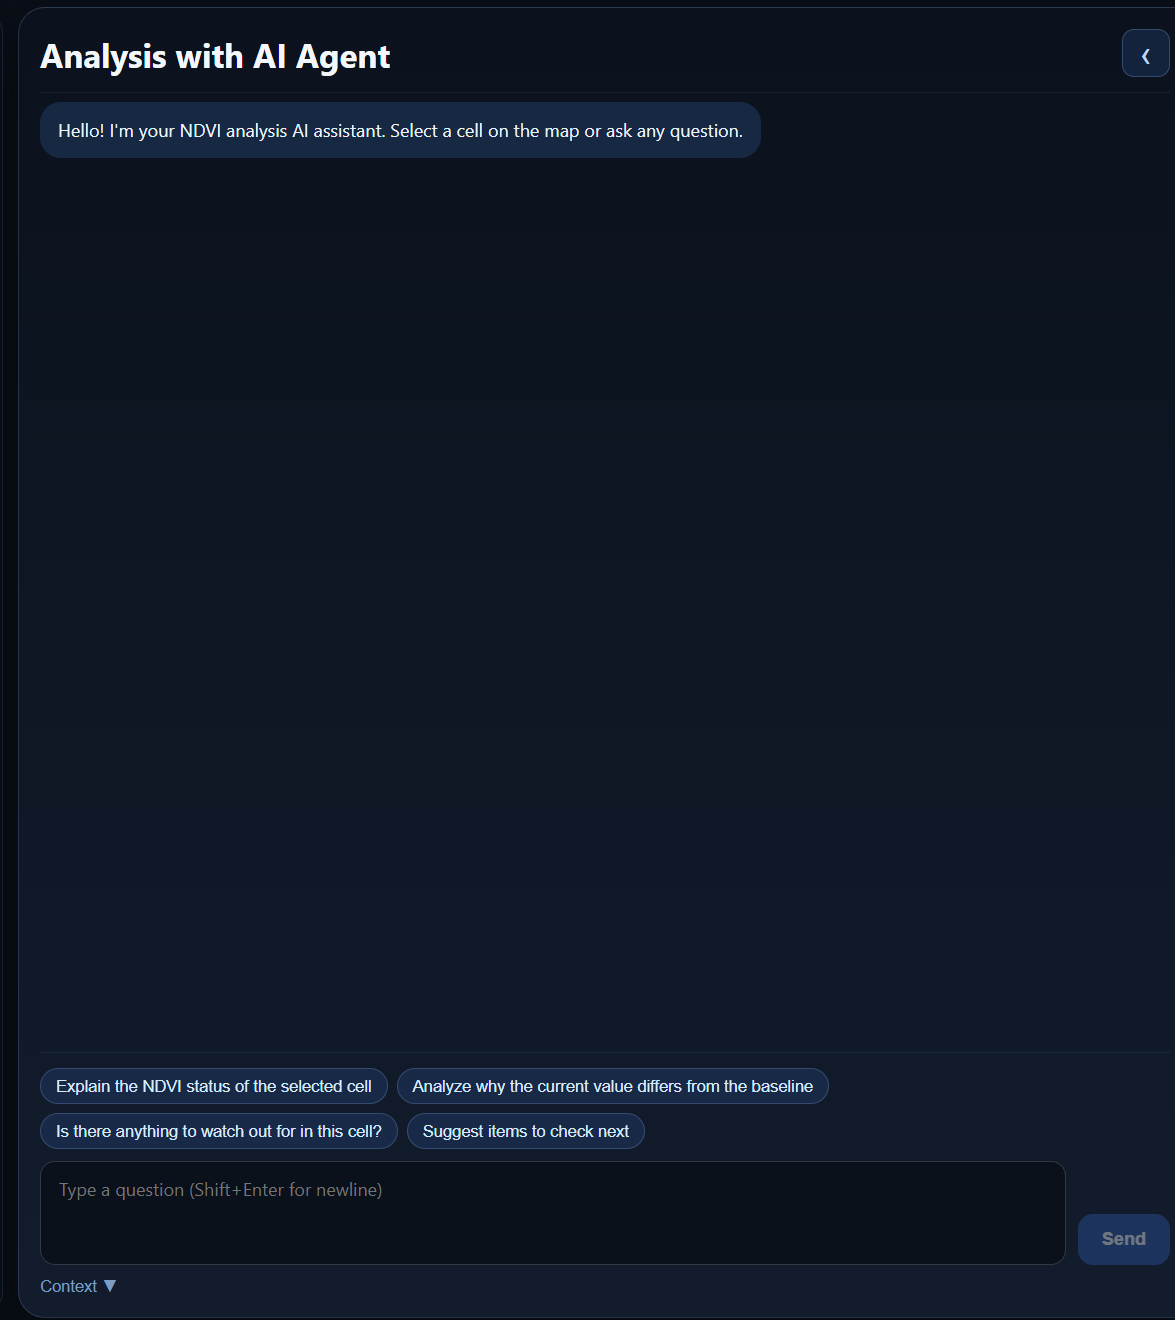
- AI agent (Claude) — Anthropic claude-sonnet-4-6 model, natural-language queries that synthesize satellite + news + WASDE + futures with cited reasoning
- Financial integration — USDA NASS, WASDE, NOAA, EIA, yfinance CBOT corn / wheat / soybean futures (15-minute delayed)
- Weekly automated reports — Korean + English PDF / DOCX with matplotlib crop-condition map, futures chart, and WASDE summary parsing
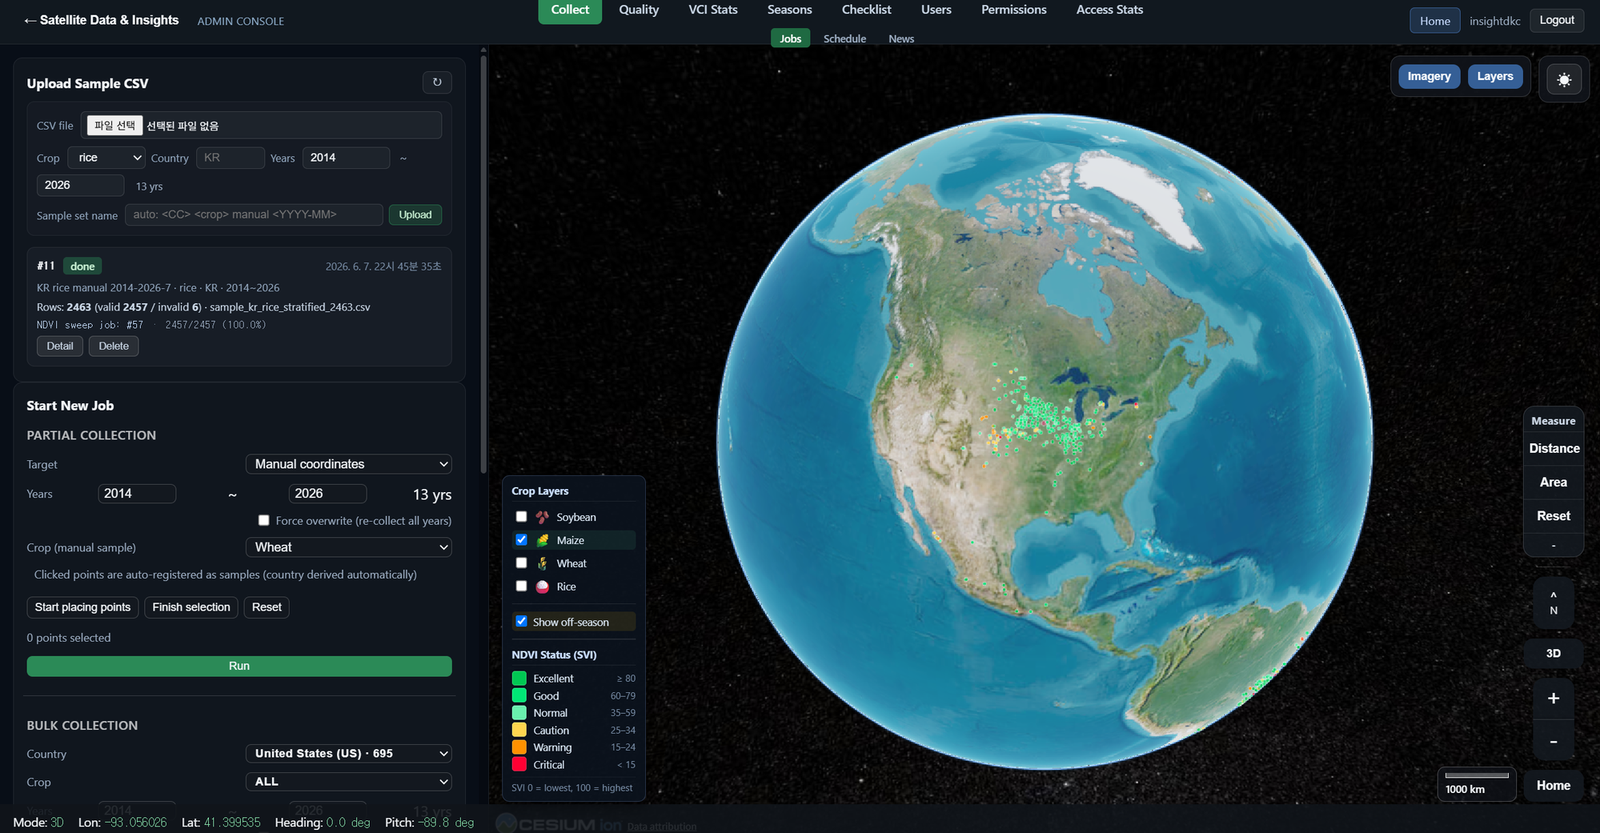
- Admin console — Jobs (CSV upload + sweep monitor), Quality (outlier detection + sample CRUD), Seasons, VCI Stats, Users, Permissions, Access Stats
- Role-based access — admin / pro / free tiers, JWT Bearer auth, AI agent gated to pro
- Cropland validation — ESA WorldCover v200 (10 m) automatic filtering of mis-located sample points
Tech stack
Python (FastAPI) backend with Google Earth Engine SDK and Anthropic Claude SDK; React 18 + Cesium 3D frontend; PostgreSQL 14 with JSONB sparse storage; alembic migrations; deployed on Oracle Cloud Infrastructure (Always Free A1 VM, Ubuntu 22.04). Source code registered for Korean program copyright (2026-06).
Try the live product
The live application is fully functional. JavaScript must be enabled — the interactive React + Cesium app mounts on top of this summary page. If you are seeing this static summary, your browser or crawler did not execute the JavaScript bundle.